Spreadsheet analysis by Aporia Systems
See what changed.
Know where to look.
Open a CSV or Excel export to inspect unusual values, check data quality and explore trends. Get a readable summary and charts without setting up a dashboard.
Start with your data
Choose a spreadsheet or structured data export.
CSV · Excel · JSON · JSONL · TSV · XML · YAML
5 files · 20 MiB each · 50 MiB total
Files are analyzed in this tab, not uploaded. Your analysis is not saved automatically—export your results before reloading or closing.
New to spreadsheet analysis? Read the practical guide →
Try it before choosing a file.
Choose a sample to see the summary, charts and source data. These examples are illustrative, not customer results.
Inside the workspace
Start with the summary.
Check the detail.
Use the overview to decide where to look. Select a signal to inspect its source column, or adjust a chart to explore a different question.
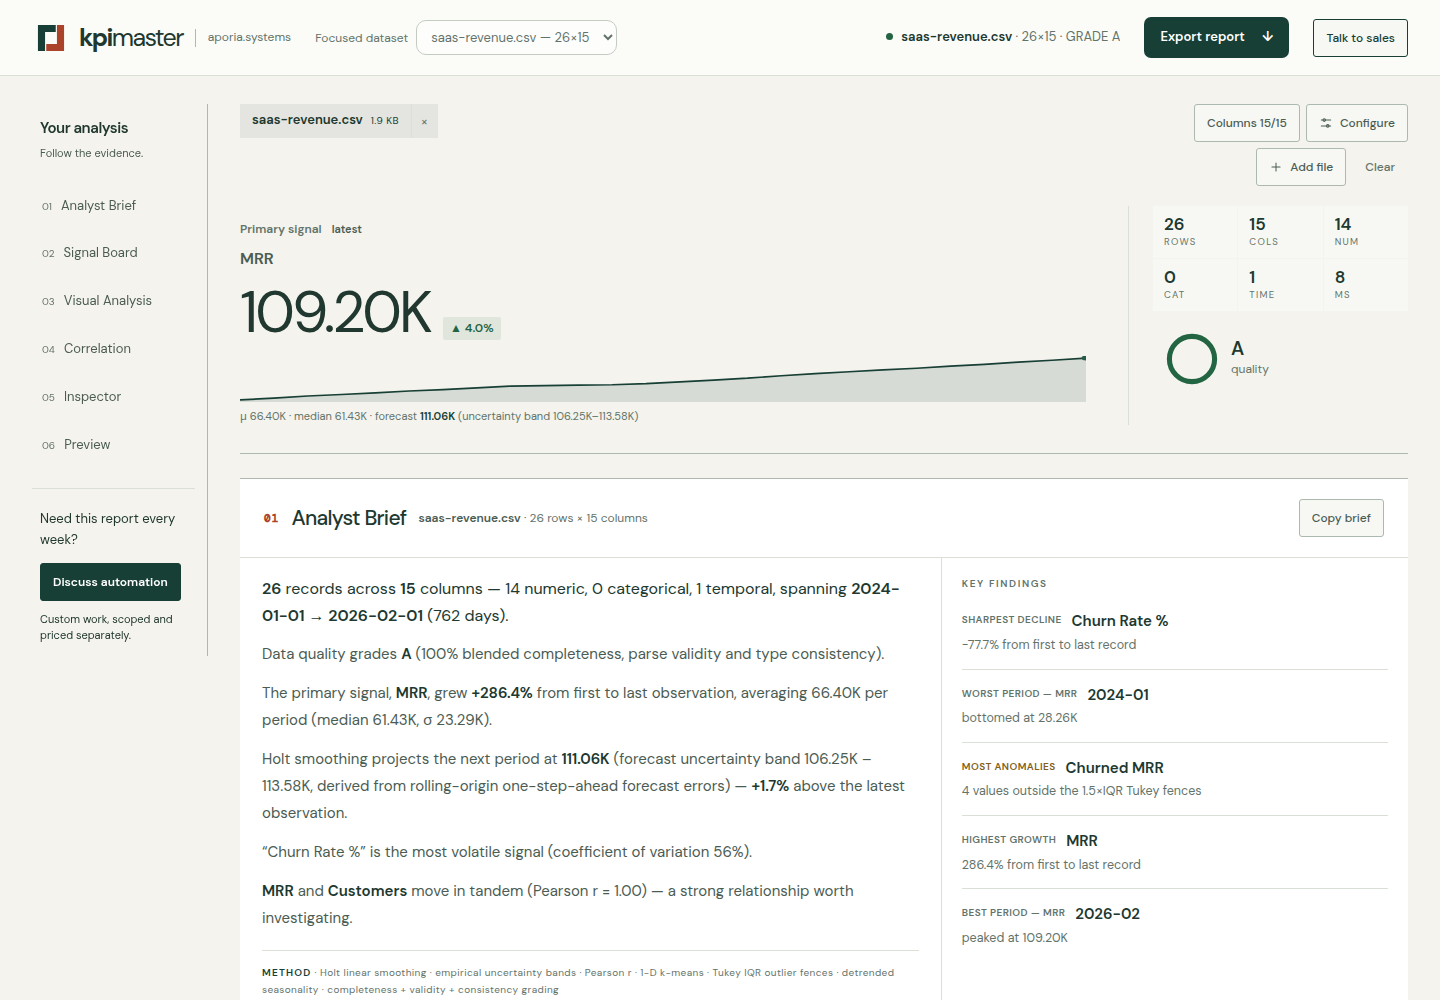
Read the brief
Review the file’s shape, data quality and notable values in a written summary. Check changes when a suitable time axis is available.
Inspect the evidence
Compare metrics, inspect source rows and confirm date conventions. A correlation can suggest a question; it does not explain a cause.
Save a report
Download a workbook, data export or standalone HTML report. Use your browser’s print dialog to save a PDF.
How the analysis works—and its limits
What the analysis covers
- Reads CSV, TSV, JSON, JSONL, XML, XLSX and YAML with automatic type, date, currency and unit detection.
- Reports a written analyst brief, ranked signals, key findings, data-quality grades and column-level profiles.
- Checks forecast quality against a last-value baseline using up to 12 recent, genuine one-step predictions. At least 19 observations are needed; a weaker result is disclosed, not hidden.
- Forecasts with Holt linear smoothing and empirical uncertainty bands — shown only when a real, validated time axis exists.
- Correlates numeric columns pairwise and ranks composition by category concentration.
- Exports JSON, XLSX, CSV, a standalone HTML report and PDF via print.
Limits to know before you start
- Up to 50,000 rows per file enter the analysis (within the parsed-grid budget below); larger files are read up to that cap with a notice.
- Grid budget: at most 128 columns and 2,000,000 parsed cells per file are accepted; oversized shapes are rejected up front, never silently truncated mid-analysis.
- Session intake is bounded: 5 files, 20 MiB per file, 50 MiB total.
- Sequence results (latest value, growth, trend, forecast, seasonality) are suppressed — not estimated — when no clean time axis or metric cadence can be validated.
- Forecasts never claim confidence or coverage; bands are empirical one-step-ahead ranges.
Keep it close
KPI Master, on your home screen
Open it like an app on your phone or desktop. Installation does not save your datasets: export anything you want to keep before closing or reloading.
You can keep using the browser tool without installing.
How to install
iPhone / iPad: open this page in Safari, tap Share, then Add to Home Screen. Enable Open as Web App if offered.
Android: use Install app or Add to Home screen in your browser menu.
Desktop: use the install icon in Chrome or Edge, or Add to Dock in Safari. Availability depends on your browser.
Offline access becomes available after the app finishes preparing. Browser storage can be cleared; the single-file edition below is a separate portable copy.
Keep a portable offline copy
Download the tool and its examples as one HTML file. Open that file in a compatible browser to analyze data without an internet connection. It is a copy of the tool, not a backup of your current analysis.
Save kpi-master-offline.html, then open it in your browser. No installation required.
Prefer the command line?
curl -fsSL https://aporia.systems/products/kpi-master/offline -o kpi-master.html
Linux · WSL · macOS — save as kpi-master.html, then open it in your browser.
Need more than a one-off analysis?
For recurring reports, integrations or larger datasets, talk to Aporia Systems about a custom solution. KPI Master’s browser tool is free. Custom work is scoped and priced separately before development begins.
Before you start
Is KPI Master free?
Yes. The browser tool is free to use without an account. Custom workflows, integrations and other development are separate projects with an agreed scope and price.
Will my work be here when I return?
Datasets and results are not saved automatically. Export what you need before reloading or closing the tab. Installing the app gives you a way to reopen the tool; it does not back up your analysis.
Is this a connected dashboard?
No. This version analyzes files you choose in the browser. It does not connect to your business systems or refresh data on a schedule. It is designed for exploring an export and preparing a report.
Is my data uploaded anywhere?
Your dataset is not uploaded: parsing, statistics and charts run in this tab. The optional contact form sends the email and message you enter; it does not attach your spreadsheet.
Which formats can it read?
CSV, TSV, JSON, JSONL, XML, XLSX and YAML, with automatic type, date, currency and unit detection.
What happens with more than 50,000 rows?
The file is read and the first 50,000 rows are analyzed; a notice tells you so. Files above 20 MiB or sessions above 5 files / 50 MiB are rejected up front with a clear message.
What is the offline edition?
A downloadable HTML file containing the analysis tool and sample datasets. Open it in a compatible browser without a server or internet connection. Export your current results separately if you want to keep them.
Analyzing…